
Wednesday 19 July 2017
Tuesday 20 June 2017
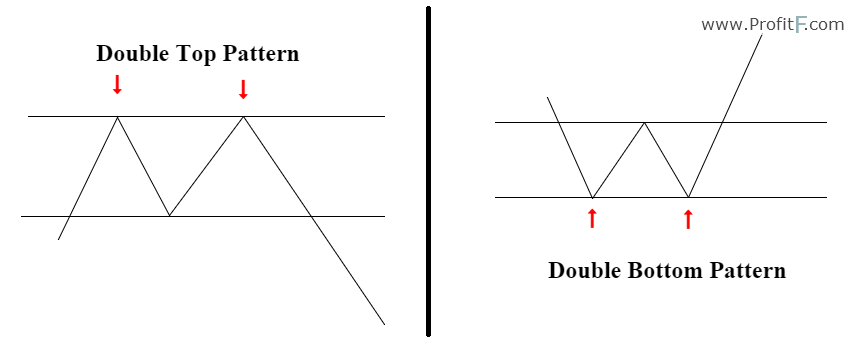
Technical Analysis: Chart Patterns - Double Tops and Bottoms
Double Tops and
Bottoms
The Double Top or Double Bottom pattern
are both easy to recognize and one of the most reliable chart patterns, making
them a favorite for many technically-orientated traders. The pattern is formed
after a sustained trend when a price tests the same support or resistance level
twice without a breakthrough. The pattern signals the start of a trend reversal
over the intermediate- or long-term.
Technical Analysis: Chart Patterns - Cup and Handle
Cup and Handle
The Cup and Handle is a bullish continuation pattern where an upward trend has paused, but will continue when the pattern is confirmed. The ‘cup’ portion of the pattern should be a “U” shape that resembles the rounding of a bowl rather than a “V” shape with equal highs on both sides of the cup. The ‘handle’ forms on the right side of the cup in the form of a short pullback that resembles a flag or pennant chart pattern. Once the handle is complete, the stock may breakout to new highs and resume its trend higher.

Technical Analysis: Chart Patterns - Head and Shoulders
Technical Analysis: Chart Patterns
Head and Shoulders
The Head and
Shoulders is a reversal chart pattern that indicates a likely
reversal of the trend once it’s completed. A Head and Shoulder Top is
characterized by three peaks with the middle peak being the highest peak (head)
and the two others being lower and roughly equal (shoulders). The lows between
these peaks are connected with a trend line (neckline) that
represents the key support level to watch for a breakdown and trend reversal. A
Head and Shoulder Bottom – or Inverse Head and
Shoulders – is simply the inverse of the Head and Shoulders Top
with the neckline being a resistance level to watch for a breakout higher.

Monday 5 June 2017


Subscribe to:
Posts (Atom)